
Joe Nicholson was a manager and tech consultant at one of the busiest restaurants in Sacramento, CA—Tower Cafe. Now, as a copywriter at SpotOn, he helps restaurant owners and managers learn how to run a more profitable operation.
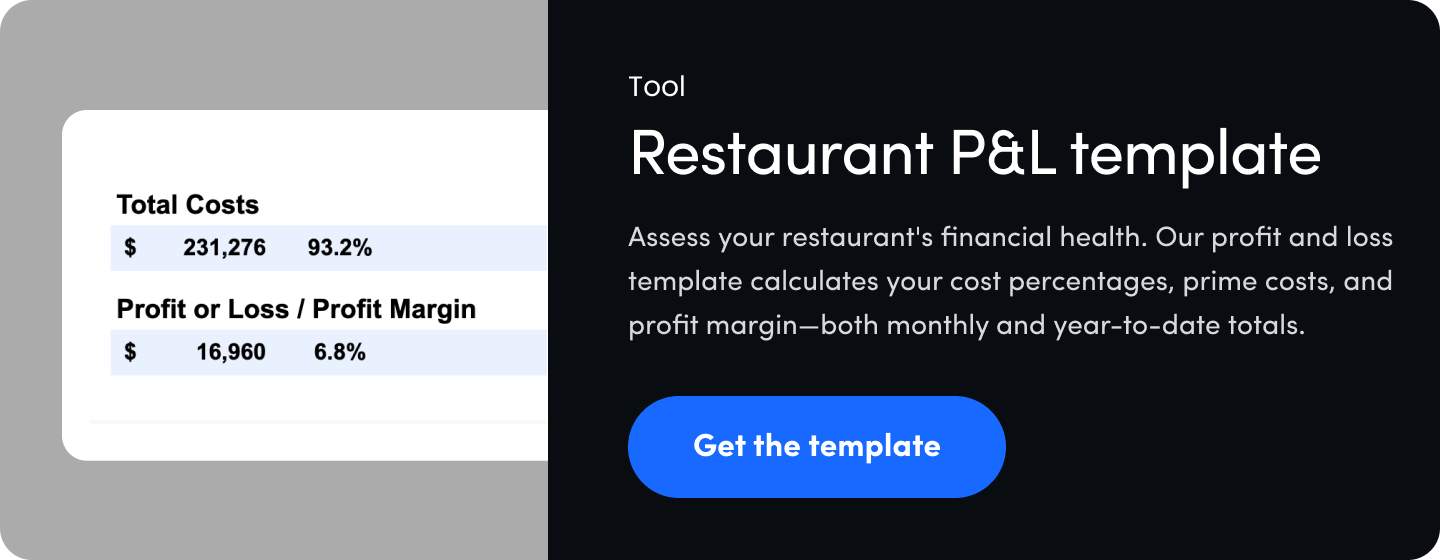
Restaurant P&L statements can be downright confusing. Prime costs. Contribution margins. Direct operating expenses. The jargon alone makes your head spin. Let's sort through the mess. We'll explain all those complicated terms. Show you what to focus on with your restaurant's finances. And give you some clear targets to shoot for. Get our free restaurant P&L template to get started.
- Restaurant P&L basics
- Sales
- Cost of Goods Sold (COGS)
- Labor costs
- Overhead costs
- Profit and profit margins
- Using your P&L statement
Restaurant P&L basics
A restaurant profit and loss statement is a spreadsheet that shows how all your money is coming in (sales) and where it's going out (costs). It reveals what percent of your sales goes to each cost line item and, most importantly, how much money is left over (profit). In short, it shows you your restaurant's profitability.
Let's look at three fundamental aspects of a P&L statement—periods, categories, and line items.
1. Periods
P&L statements can be reported over various periods—a week, month, quarter, or year. Usually, a P&L will specify which period it's reporting for at the top. Our P&L template lets you add your info for each month and calculates your year-to-date totals. For weekly or more in-depth reporting, accounting software that integrates with your POS system is recommended.
2. Categories
The five common main categories of P&Ls are Sales, Cost of Goods Sold (COGS), Labor, Controllable Costs, and Non-Controllable Costs. These could be broken down differently. Sales are usually listed first. Then costs go in order from most controllable to least controllable. Each cost category represents a percentage of your sales. Your profit margin is the percentage left over after all costs are taken out.
3. Line items
Within each category are line items. If you're using a Google Sheet (or Microsoft Excel) P&L template, you may just have 5 to 10 line items per category. In a P&L that's generated by accounting software, like Quickbooks, you could have more. Your P&L line items should be consistent with those on other platforms you're using—point-of-sale, inventory management, and accounting software. We'll give you some ideas for these in the sections below.
Sales
The sales section on your P&L statement should show your net sales. That's your sales without sales tax before comps and discounts are removed. Let's define gross and net sales.
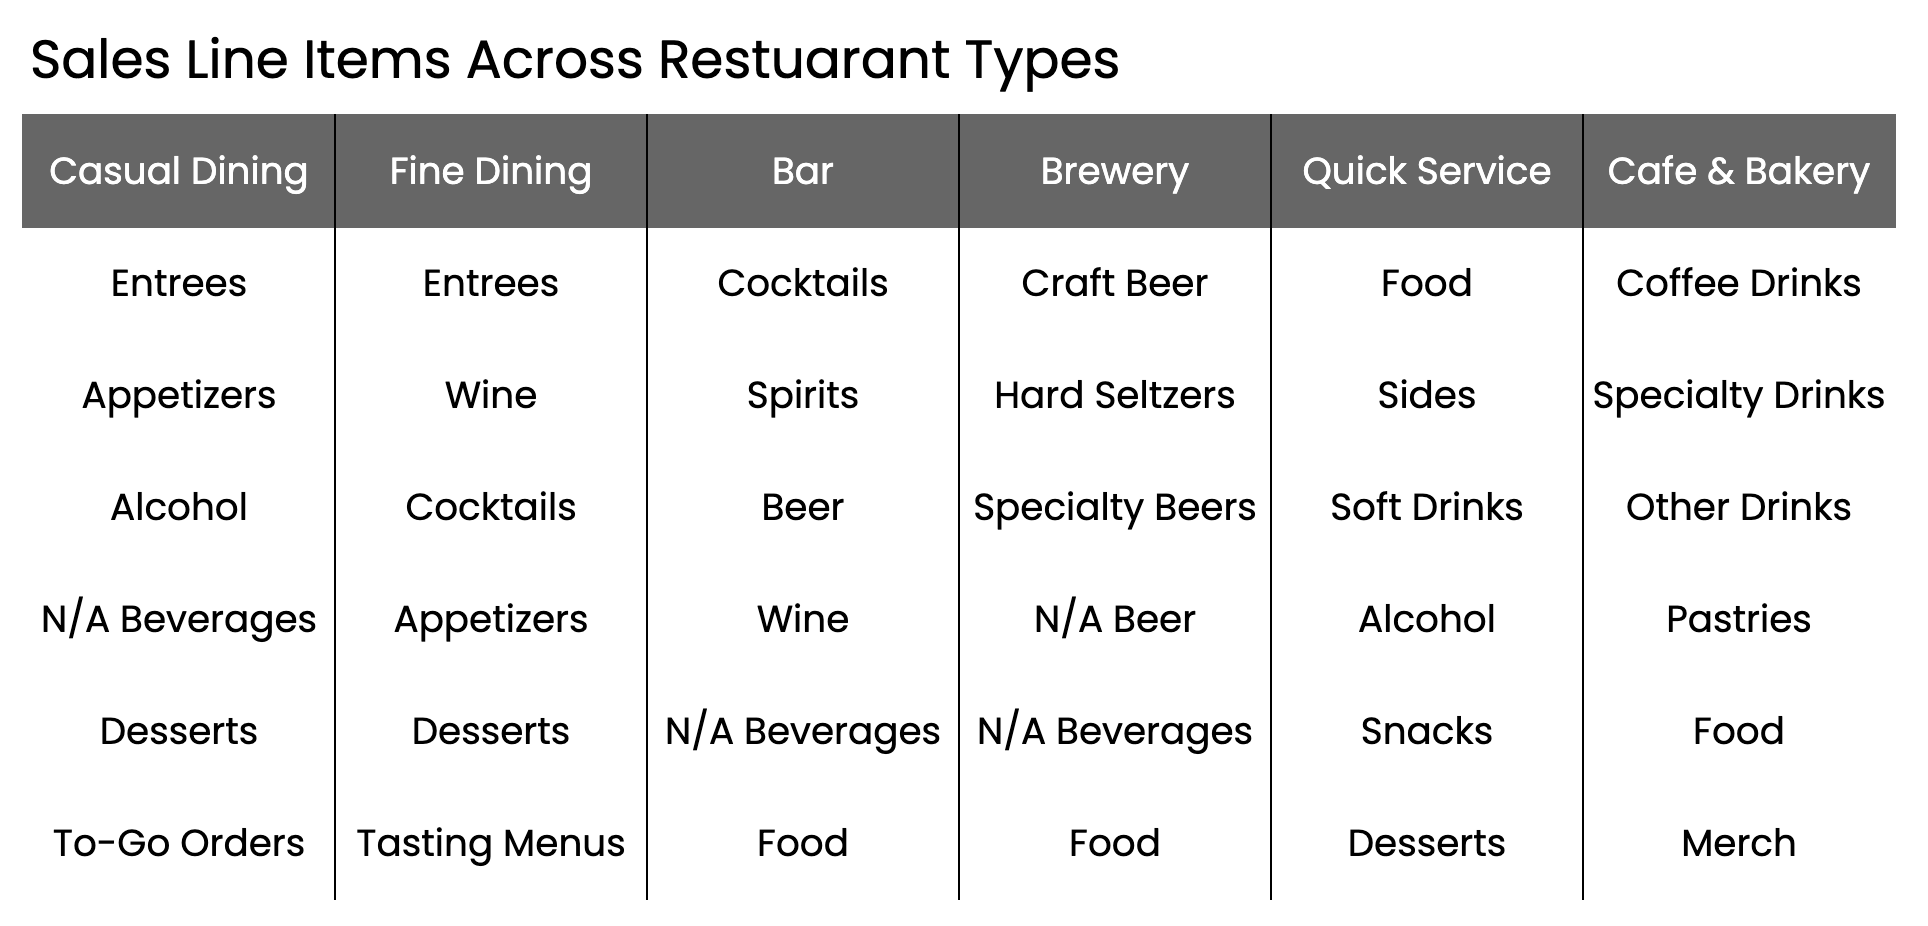
Sales by product type
When comparing sales to costs, the most common way to group sales is by product type. Your sales line items should match the ones in your POS reporting. That could simply be food sales, alcohol, and non-alcoholic beverages. However, depending on your restaurant type, you may want to get more granular. If you're a fast-casual place and only offer a couple of alcoholic beverages, then "alcohol" should be enough. But if you're a brewery, then you'd probably break your line items down further into beer types. Here are some ways different restaurants may group their products.
Cost of Goods Sold (COGS)
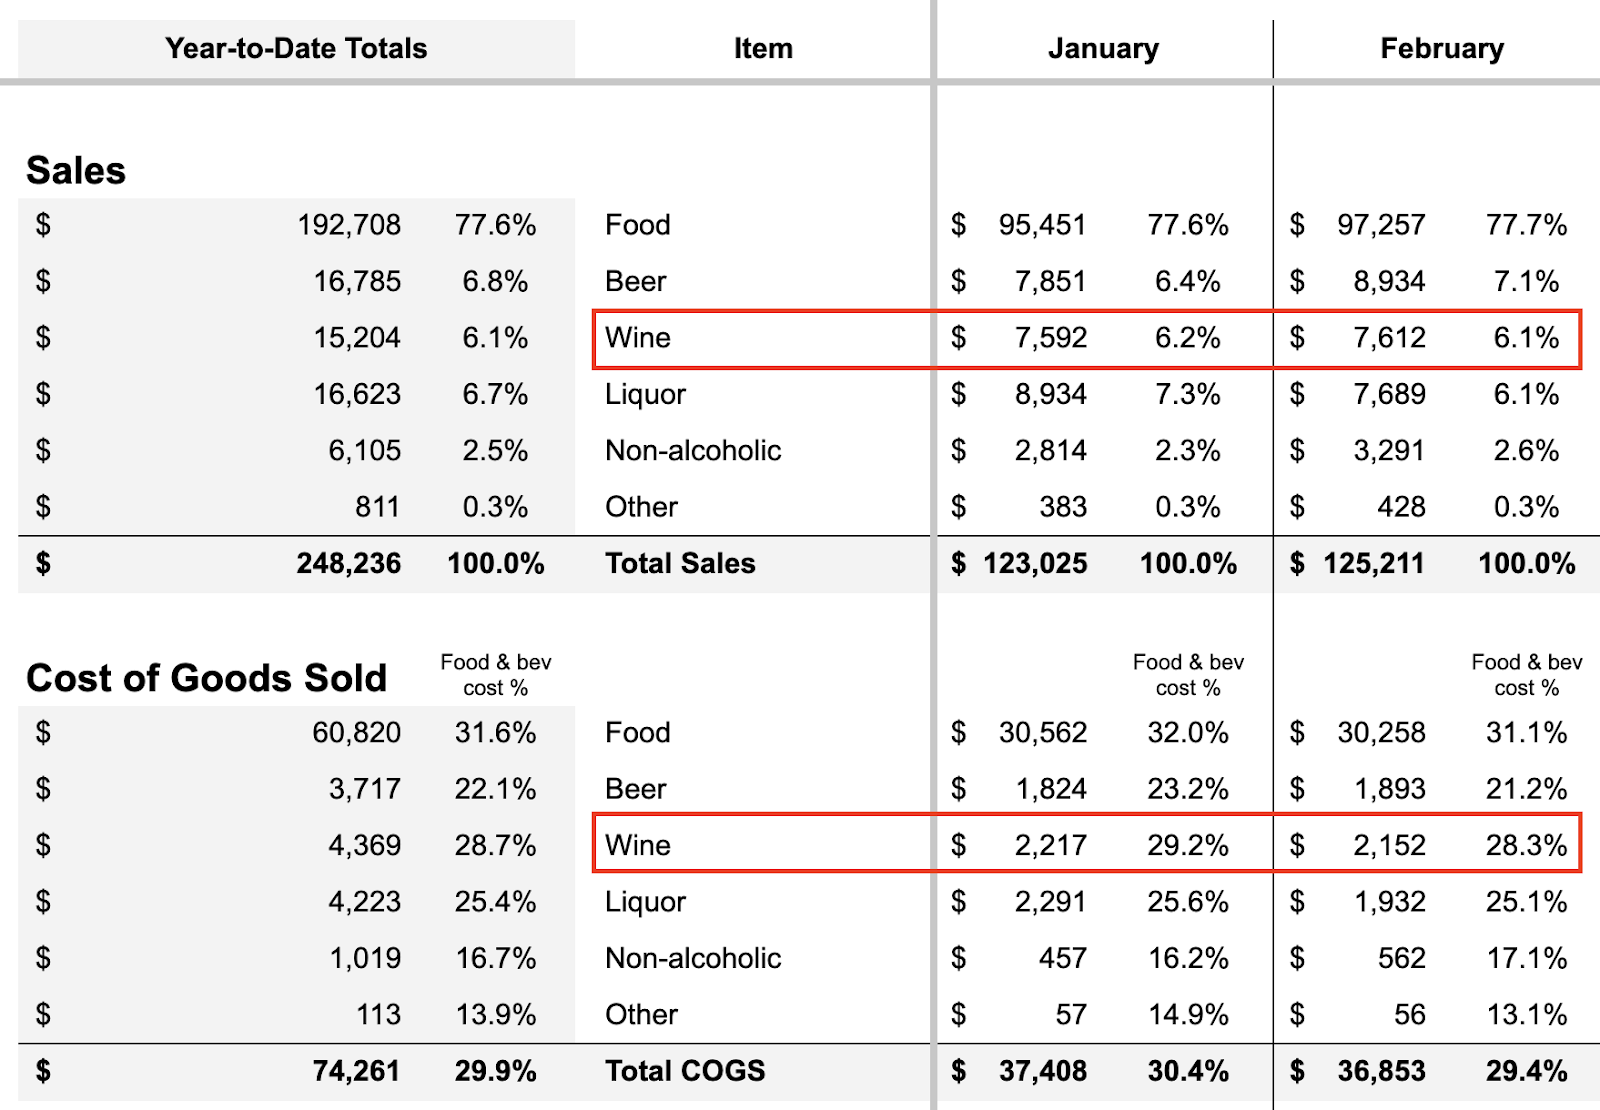
Your Cost of Goods Sold is the cost of your food and beverages. These should be identical to those in your sales section, so your food and beverage cost percentages for each COGS line item are accurate. By tracking these percentages you can make sure your costs are staying within budget.
For example, if your wine sales in January were $7,592 and your wine costs were $2,217, then your wine cost percentage is calculated to be 29.2% (2,217 ÷ 7,592). That may be too high. So you may have your bartenders work on their pours and you raise prices on three popular reds. Then, in February, even though your sales ($7,612) were about the same as in January, your wine cost percentage dropped to 28.8% because your costs went down to $2,152.
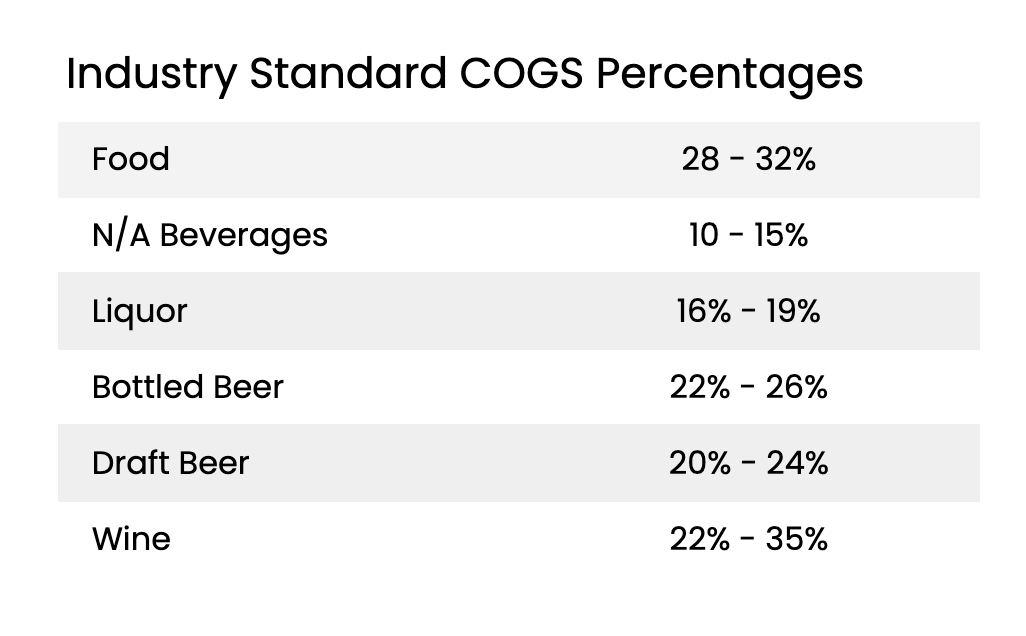
COGS targets
Different restaurant types will have different cost percentage targets. Since full-service has a higher labor cost percentage than quick-service, they might shoot for a lower COGS percentage. Your total COGS should be between 25% and 35%. Let's look at some restaurant industry standards for each line item.
Gross profit margin
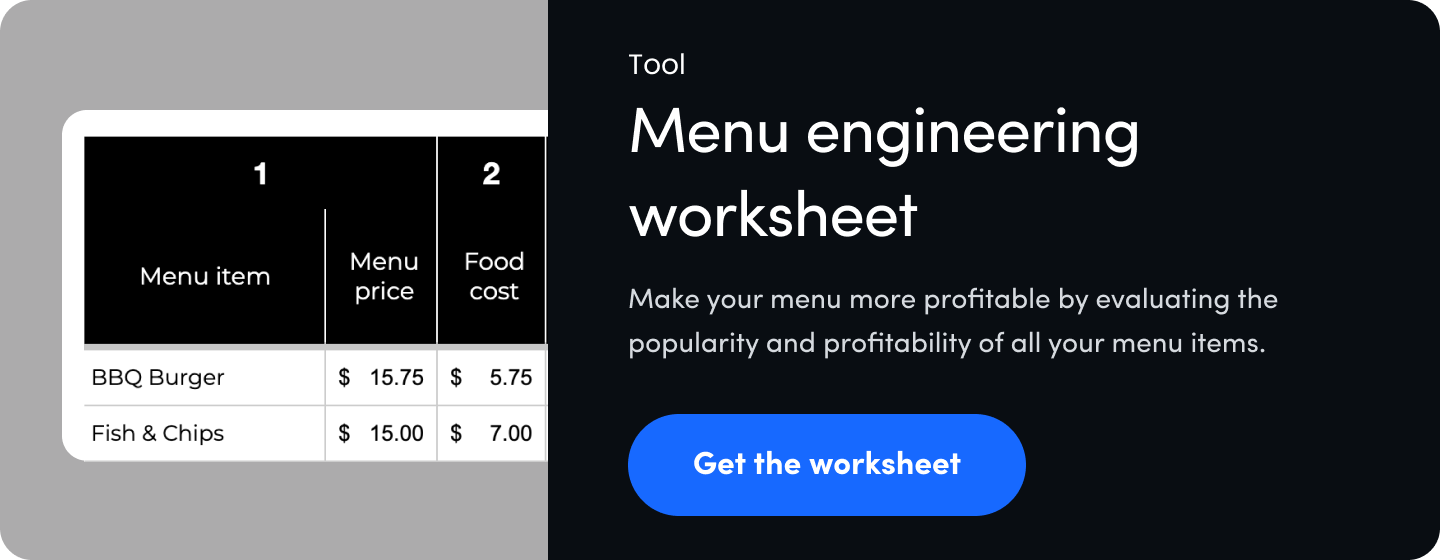
Gross profit margin measures how much money you have left over after COGS is taken out and is used to measure the profitability of your menu. You can go even deeper with menu engineering, which is the process of evaluating each menu item's sales (popularity) and gross profit margin (profitability). This helps you determine which items you should keep, modify, and remove altogether.
If your sales are $100,000 and your COGS is $30,000, then your gross profit is $70,000 (100,000 - 30,000 = 70,000). In this scenario, your gross profit margin would be 70% (70,000 ÷ 100,000 = 0.70 or 70%).
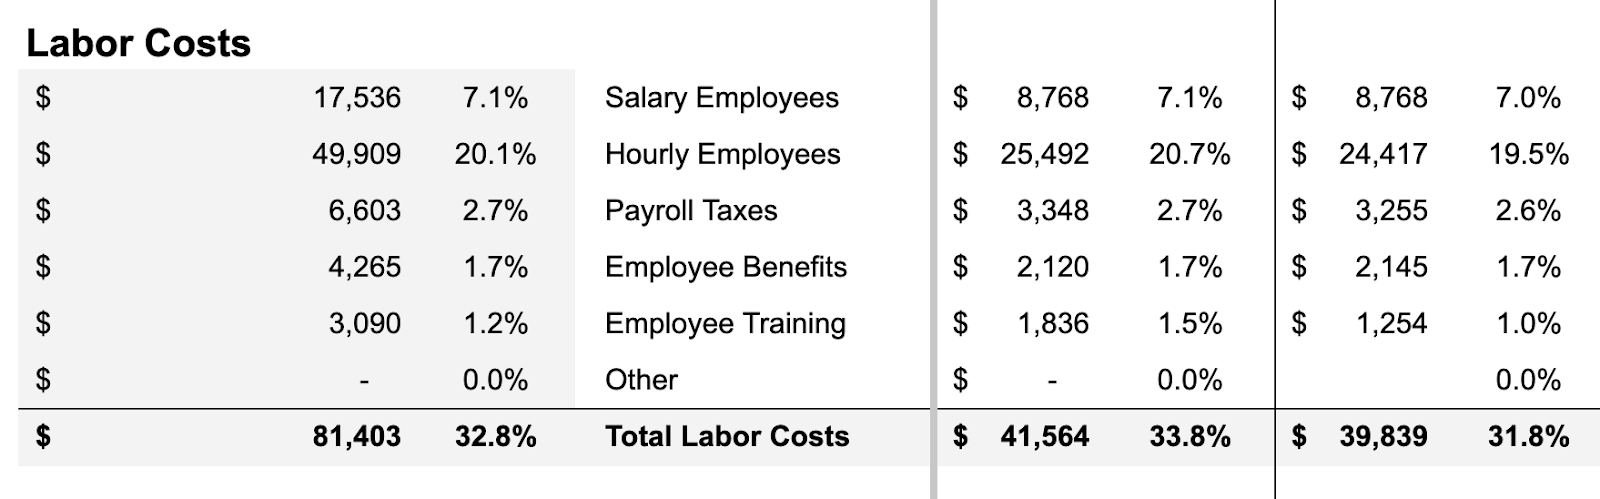
Labor costs
After COGS, your next primary expense is labor or payroll. Depending on your service style, this can range from 25% to 35% of your sales. Anything over that is probably too high. Your primary labor costs are what you're paying your employees regularly. This can be grouped in a few different ways.
- By how they are paid: Hourly, Salary
- By department: Front-of-House, Back-of-House, Management
- By department and level: Culinary, Culinary Management, Service, Service Management
If your labor is going over your target, you'll want to see how you can reduce overtime (see below) and irregular hours. To do this consider using restaurant scheduling software so you can see sales projections right inside schedules. As you make your schedule, the software shows you how much each shift costs and allows you to set a budget that the scheduling manager can't exceed.
Handhelds are another way to reduce labor costs in full-service operations. They enable your servers to take more tables which in turn means fewer employees on the clock. A reduction of 2 serving shifts, at $14 an hour, at 6 hours, over a month (30 days) would save you $5,040. Pretty substantial.
Let's look at some other costs that might be in your labor section.
- Overtime: Extra pay to employees (usually 1.5 x wages) when they work more than 8 hours/day or 40 hours/week
- Payroll taxes. Mandatory contributions such as FICA (Social Security and Medicare), unemployment taxes, state taxes, and other government-mandated taxes
- Employee benefits. Health insurance, retirement plans (401(k)), paid time off (PTO) (vacation, sick leave, holiday pay), workers compensation, and meal discounts
- Training and onboarding. Paid training hours for new employees, ServSafe certification, training programs, free meals, etc
- Bonuses. Additional compensation given to employees for exceptional performance or during specific periods, including seasonal contests or end-of-year awards
Assessing profit after COGS and labor costs
After COGS and labor costs are taken out, it's a good time to evaluate your profit. Look at the amounts and percentages of your COGS and labor (prime costs) and see if you need to cut costs. Your prime costs should be between 55% and 65%. Lower is better. After that, it's time to see how much is left over (contribution margin). Typically this should be between 35% and 45%. Higher is better here. Our P&L template calculates your prime costs when you enter your sales and costs information.
Overhead costs
Overhead costs are all other costs besides the Cost of Goods Sold (COGS) and labor costs. This can also be referred to as operating costs. Restaurants will group these costs in various ways, but for simplicity's sake, we'll separate them into two categories—controllable costs and non-controllable costs.
Controllable costs
As the name would suggest, controllable costs are the ones that you have the most control over. These could also be called variable costs or direct operating costs.
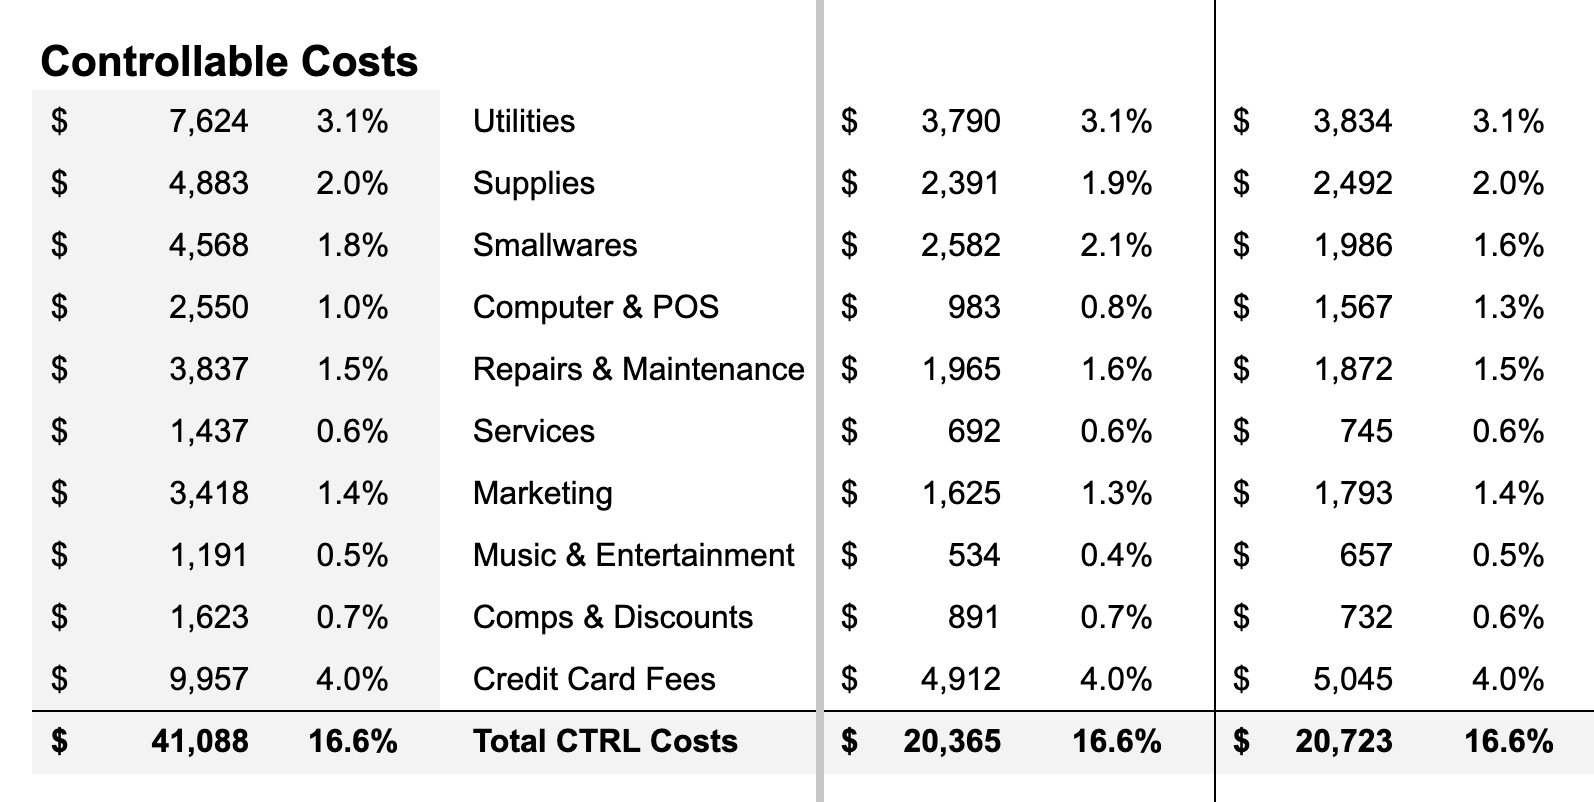
Controllable costs can include:
- Utilities. Electricity, water, gas, trash, internet, wood, charcoal. Utility costs vary based on use, the season, and equipment efficiency.
- Supplies. Cleaning, packaging (to-go supplies), printing, menu, office, dining room, kitchen, office, event, rentals, uniforms, first aid, etc. Break these out into separate line items depending on what you want to monitor.
- Smallwares. Low-cost, non-capitalized kitchen tools and dining essentials, such as knives, cutting boards, mixing bowls, plates, glassware, and utensils. These are typically replaced frequently due to breakage and wear.
- Computer & POS. Point-of-sale (POS) systems, software subscriptions, credit card processing fees, and computer hardware.
- Repairs & maintenance. Fixing kitchen equipment, HVAC systems, plumbing, refrigeration units, and general facility upkeep. This helps reduce future equipment purchases.
- Services. Pest control, linen and uniform services, grease trap cleaning, and security guards.
- Marketing. Digital advertising, marketing software, printed menus, signage, promotions, and loyalty programs. Delivery app commissions are also considered a marketing fee because you're paying to be seen on their platform. To reduce high third-party commissions up to 30% or more) consider implementing POS online ordering.
- Music & entertainment. In-house entertainment, including live music, DJs, streaming service subscriptions (e.g., Spotify, ASCAP/BMI licensing fees), and special events.
- Comps & discounts. The cost of meals, drinks, or discounts given to customers, investors, or promotional partners. These should be tracked to prevent excessive giveaways. Employee discounts should be recorded in the labor section.
Example: Cost: Purchasing a commercial oven for $5,000. This is a cost because it's a long-term asset that provides value over time. Expense: Depreciation on the oven, say $500 per year, is an expense because it's the portion of the cost allocated as a business expense for that year.
Non-controllable costs
While technically you do have some control over every cost, non-controllable costs are more rigid. Think of your lease, insurance, and licenses. These can also be referred to as fixed costs or non-operating expenses.
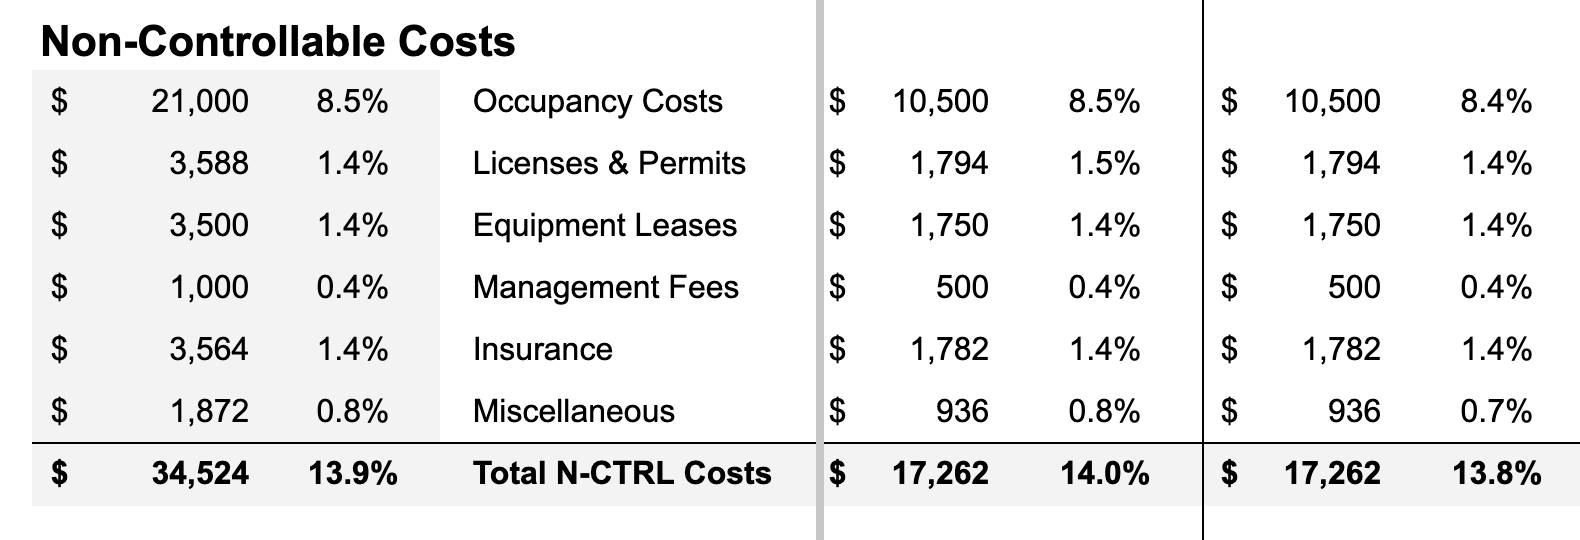
Here's how non-controllable costs might be grouped.
- Occupancy costs. Rent or lease payments, property taxes, and common area maintenance (CAM) fees
- Licenses & Permits. Business licenses, health permits, liquor licenses, food handler certifications, and fire safety permits. These vary by location and industry regulations.
- Equipment leases. Leasing kitchen equipment, financing POS systems, or other operational tools instead of purchasing them outright. Leasing allows for lower upfront costs but results in ongoing monthly payments
- Management fees. Compensation paid to management companies or consultants for overseeing restaurant operations. This could include franchise fees, third-party management agreements, or advisory services.
- Insurance. Coverage costs for protecting the business from risks, such as general liability, property insurance, and liquor liability insurance. Premiums depend on the type of coverage and restaurant size.
Profit and profit margins
Restaurant profit, also referred to as income, is how much money from sales is left over after all costs are taken out. Profit margin is the percentage of sales that profit makes up. The average restaurant profit margin is around 5%. Often many restaurants will aim to spend 30% on COGS, 30% on labor, and 30% on overhead to get a 10% profit margin.
Our P&L template will automatically calculate your monthly and year-to-date profit and profit margins when you enter your data.
Using your P&L statement
Whether you're trying to bring on investors, get a rental contract, or see more money in your bank account, assessing your restaurant's financial health is the purpose of the P&L statement. The first step to getting good results is to make sure your sales and costs are accurate as you enter them. The second part is reviewing your P&L to see where you can cut costs and increase sales to ultimately boost your restaurant profit margins.
A POS system that integrates seamlessly with its products and third-party integrations can help you boost sales, run more efficiently, and see more profit. That lets you expand your restaurant, open more locations, or just spend time with your guests. Whatever your goals happen to be.