
The restaurant industry today looks very different than it did a few years ago. Food costs have risen dramatically, ongoing labor shortages make it difficult for establishments to stay open, and the next generation of guests crave new dining experiences.
To understand how these changes are affecting the industry and, more importantly, how restaurants can adapt and thrive in the coming years, we have to dive into the data. These stats are pulled from the latest reports of the National Restaurant Association. And while they do clearly show the challenges restaurant owners are facing, they also indicate a profitable future for those willing to adapt to change.
General restaurant industry statistics
Key takeaway: In spite of the economic challenges, eating out is still in demand, and the industry is growing as restaurants find innovative ways to serve guests.
- The restaurant industry reached $997 billion in sales in 2023
- The restaurant industry is expected to reach $1.2 trillion in sales by 2030
- 47% of restaurant owners expect competition to be more intense than previous years
- 90% of restaurant operators say inflation poses a significant challenge for their restaurant
- The average restaurant pre-tax income went down by $155,824 over the past 3 years
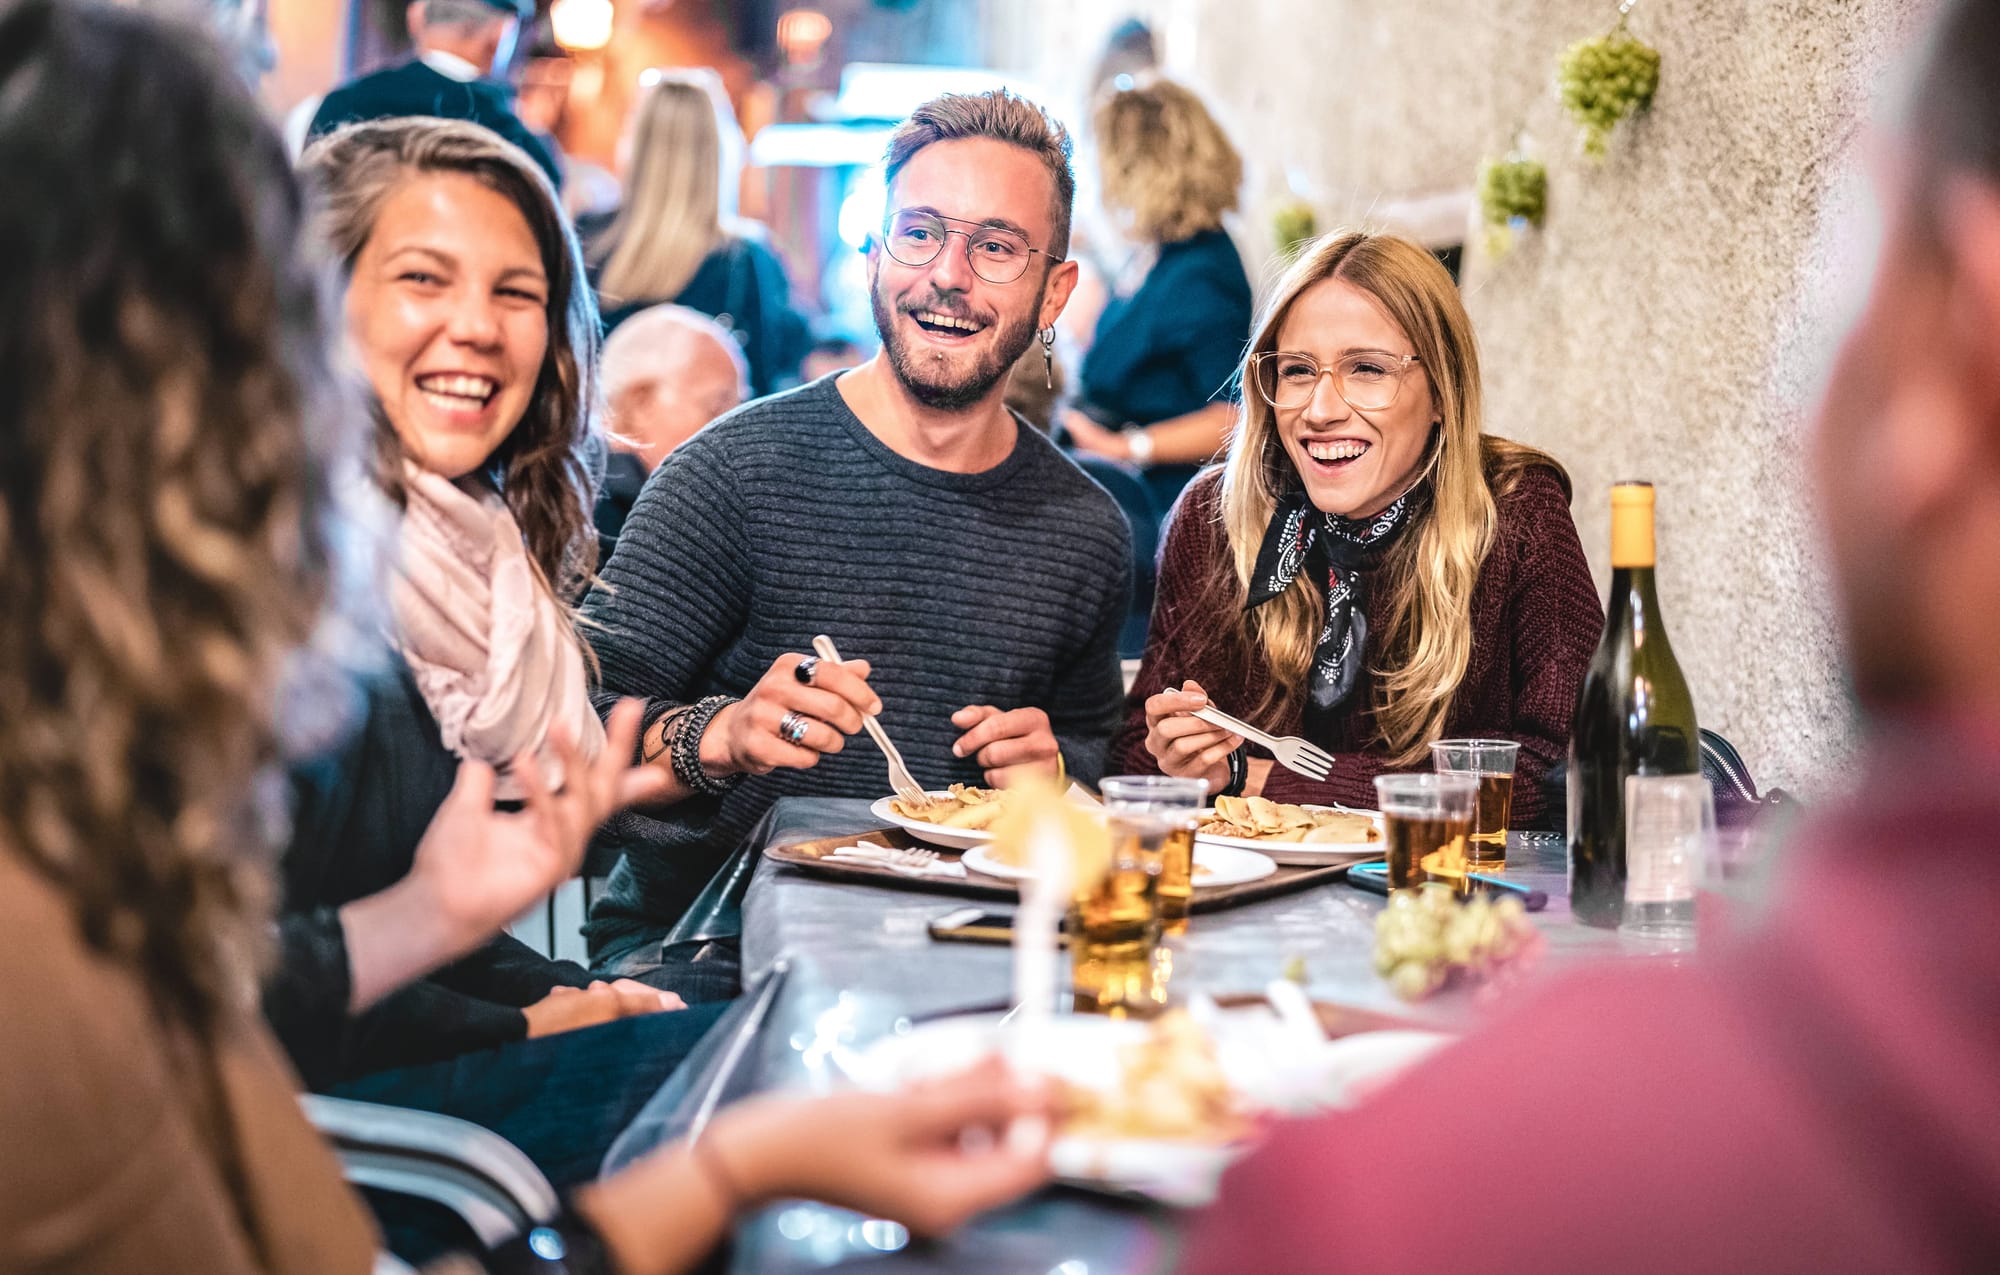
- 84% of consumers say going out to a restaurant with family and friends is a better use of their time than cooking
- 64% of consumers consider restaurants essential to their lifestyle
- 21% of restaurants incorporated more technology into their restaurant because of higher costs
Food cost statistics
Key takeaway: Food costs are up, but the real question is: how can restaurants still make money? With menu engineering, a restaurant owner can make profitable menu pricing and ingredient changes by looking at the profitability and popularity of each item. See how Dan Slowinski optimized the menu at his restaurant—The Muse at Cedar Creek.
- Restaurant food costs (food and beverage) rose by 21.8% over the past 3 years
- 92% of restaurants say higher food costs are a significant challenge for their business
- 88% of restaurants say food and beverage costs are higher than 3 years ago
- 93% of operators say their total food costs (as a % of restaurant sales) are higher than 3 years ago
- 87% of restaurants say they increased menu prices because of higher food costs
- 57% of restaurants report they changed menu items because of higher food costs
- 79% of adults are favorable to variable pricing
- 71% of adults would order smaller-sized portions for a lower price if it was offered
Restaurant labor statistics
Key takeaway: Labor is expensive and hard to come by, especially in full-service restaurants. Tech like a handheld POS system, QR codes, and a kitchen display system enables restaurants to do more with less staff, effectively reducing their labor budget.
- Restaurant labor costs rose by 18.3% over the past 3 years
- 89% of restaurants say higher labor costs are a significant challenge
- 32% of restaurants cut staffing levels because of higher costs
- 62% of operators report being understaffed to meet current customer demand
- 19% of restaurants postponed plans for new hiring because of higher costs
- 46% of adults say their first regular job was in the restaurant industry
- 17% of adults say they’ve worked in the restaurant industry but not as a first job
- 63% of U.S. adults worked in the restaurant and food service industry at some point in their lives
- There were 12.3. million restaurant and food service jobs just before the pandemic hit in February 2020
- In September of 2023, restaurant and food service jobs returned to pre-pandemic levels at 12.3 million jobs
- Counter-service employment has grown by 117,000 between February 2020 and August 2023
- Full-service restaurant employment has fallen by 212,000 between February 2020 and August 2023
- There are predicted to be 17.2 million restaurant and food service jobs in 2030
Online food ordering and food delivery statistics
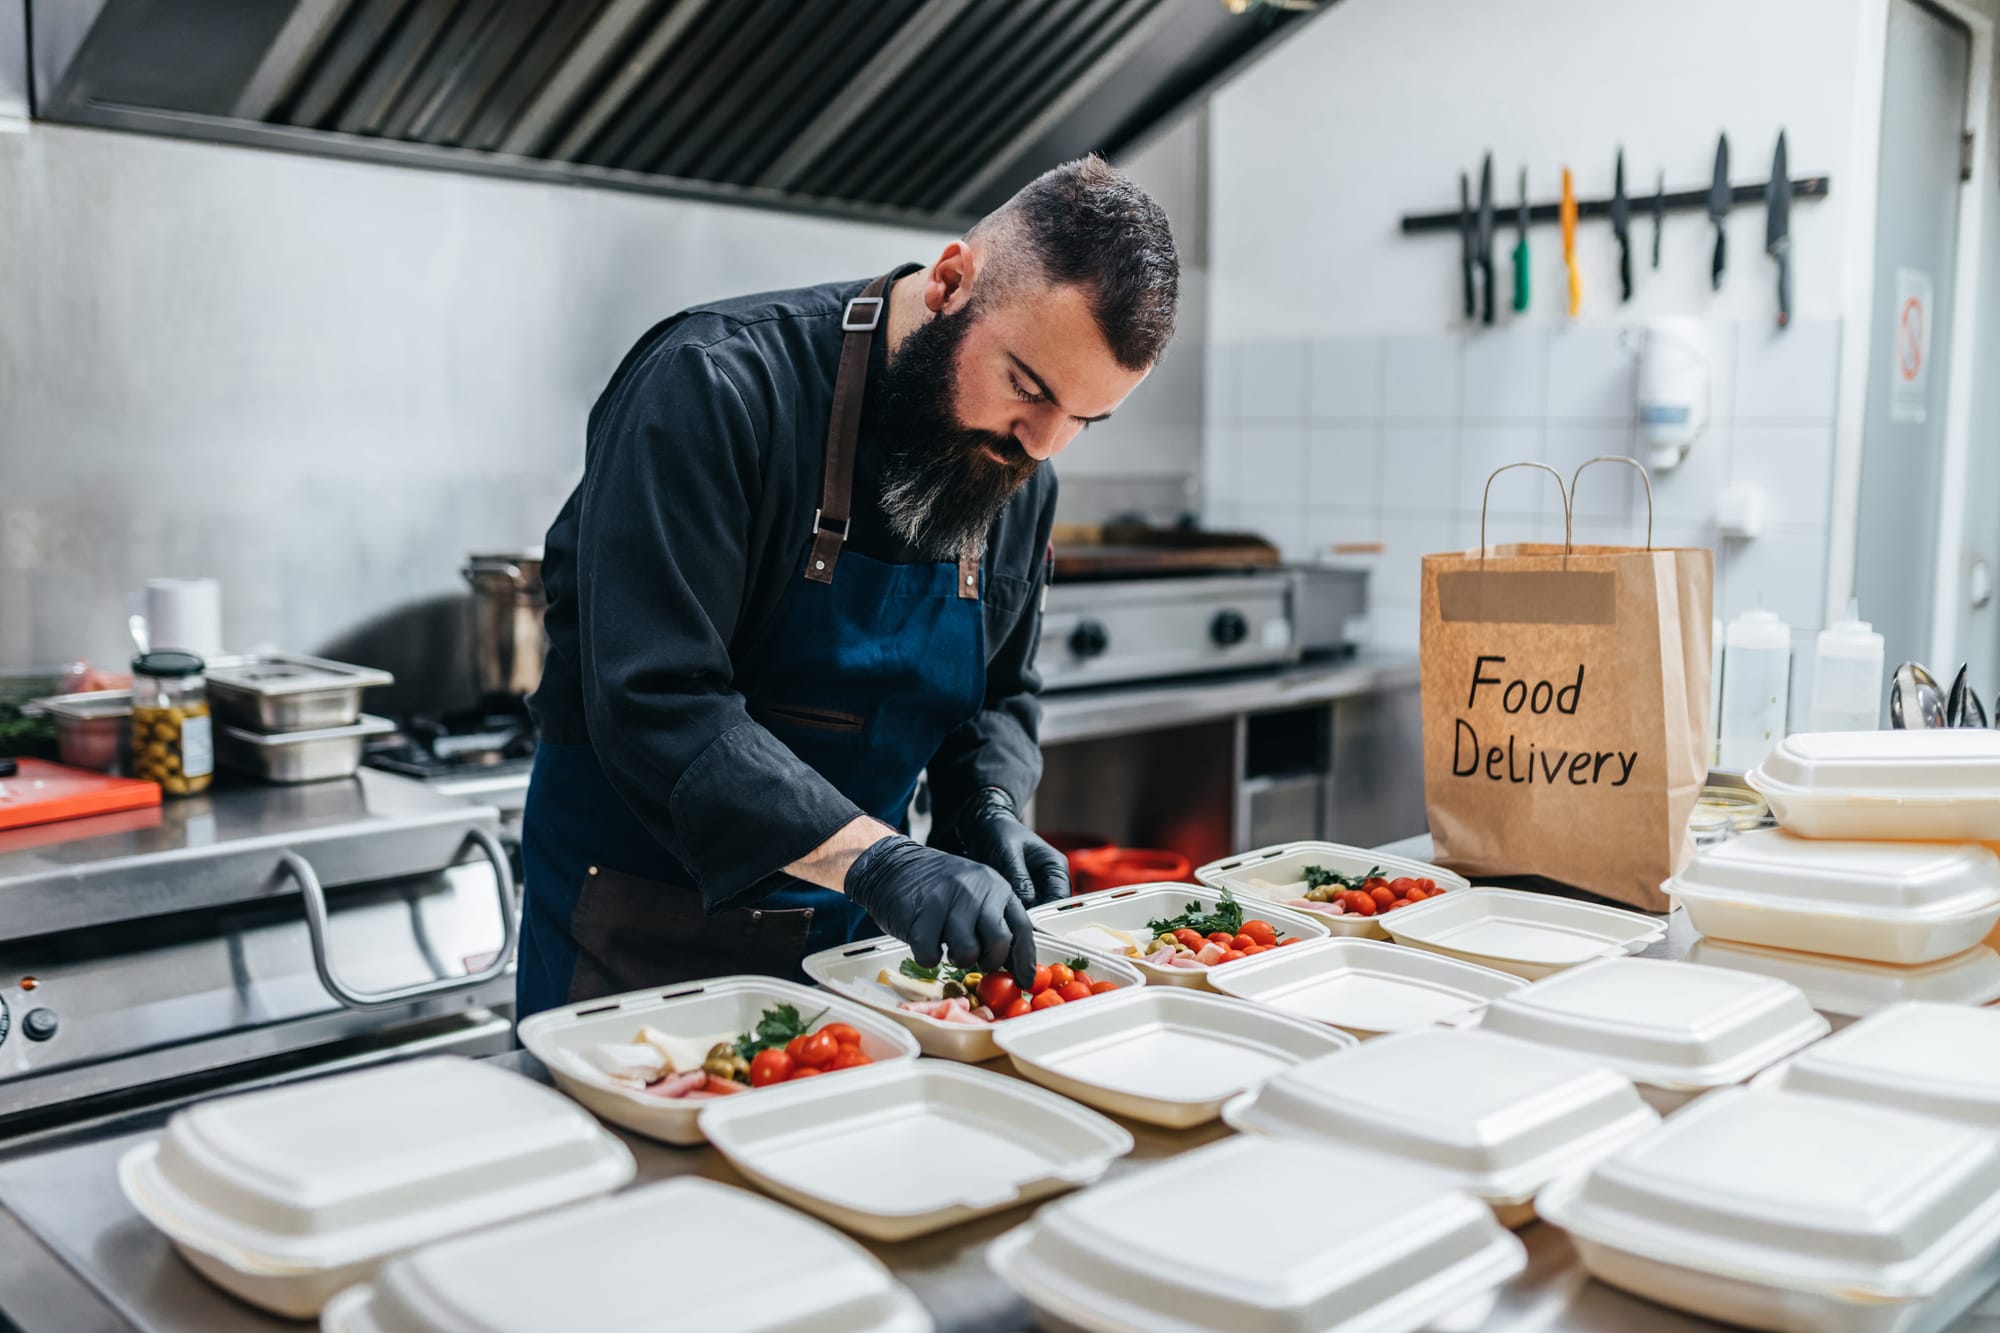
Key takeaway: Guests love online ordering and off-premise dining, but delivery apps take big commissions. With a POS online ordering system, restaurants can keep their profit and their data while making ordering food online easy for customers.
- 66% of adults say they’re more likely to order takeout from a restaurant than they were 3 years ago
- 55% of adults say they’re more likely to order food delivery from a restaurant than they were 3 years ago
- 55% of consumers say purchasing takeout or delivery is essential to the way they live
- 55% of delivery customers would prefer to order delivery directly from the restaurant—even though most restaurants use 3rd-party delivery apps
- 13% of restaurants eliminated 3rd-party delivery apps because of higher costs
- 73% of delivery customers ordered food delivery through a 3rd-party service over the past six months
- 90% of restaurants that offered alcohol to-go during the pandemic will continue to do so if their jurisdiction allows it
- 70% of adults say it's important that food comes from a restaurant with a physical location that's accessible to the public
- 57% of consumers are more likely to incorporate restaurant-prepped items with home-prepared meals than 3 years ago
- 46% of adults would order food that's delivered by a self-driving car
- 41% of adults would order food that's delivered by a drone
- 37% of adults would order food that's delivered by a robot
Full-service takeout and food delivery statistics
Full service includes sit-down family dining, casual dining, and fine dining restaurants.
- 11% of full-service restaurants run their own delivery service
- 19% of full-service restaurants use both a 3rd-party provider and their own delivery service
- 60% of full-service restaurants say delivery sales represent a larger proportion of sales volume than 3 years ago
- 66% of full-service restaurants offered alcohol to-go for takeout and delivery orders during the pandemic
- 45% of full-service restaurants offered food delivery at some point during the pandemic
- 64% of full-service restaurants that offered delivery during the pandemic say it was their first time
- 34% of full-service restaurants expect dedicated takeout counters or windows to be more common in the future
- 30% of full-service restaurants expect curbside pickup to be more common in the future
Counter service takeout and food delivery statistics
Counter service includes cafés, bakeries, quick service, and fast-casual restaurants.
- 55% of counter-service restaurants say delivery sales represent a larger proportion of sales volume than 3 years ago
- 15% of counter-service restaurants run their own delivery service
- 27% of counter-service restaurants use both a 3rd-party provider and their own delivery service
- 59% of counter-service restaurants offered alcohol to-go for takeout and delivery orders during the pandemic
- 65% of counter-service restaurants that offered food delivery at some point during the pandemic
- 35% of counter-service restaurants that offered delivery during the pandemic say it was their first time
- 49% of counter-service restaurants expect dedicated takeout counters or windows to be more common in the future
- 34% of counter-service restaurants expect curbside service to be more common in the future
Restaurant ordering and payment statistics
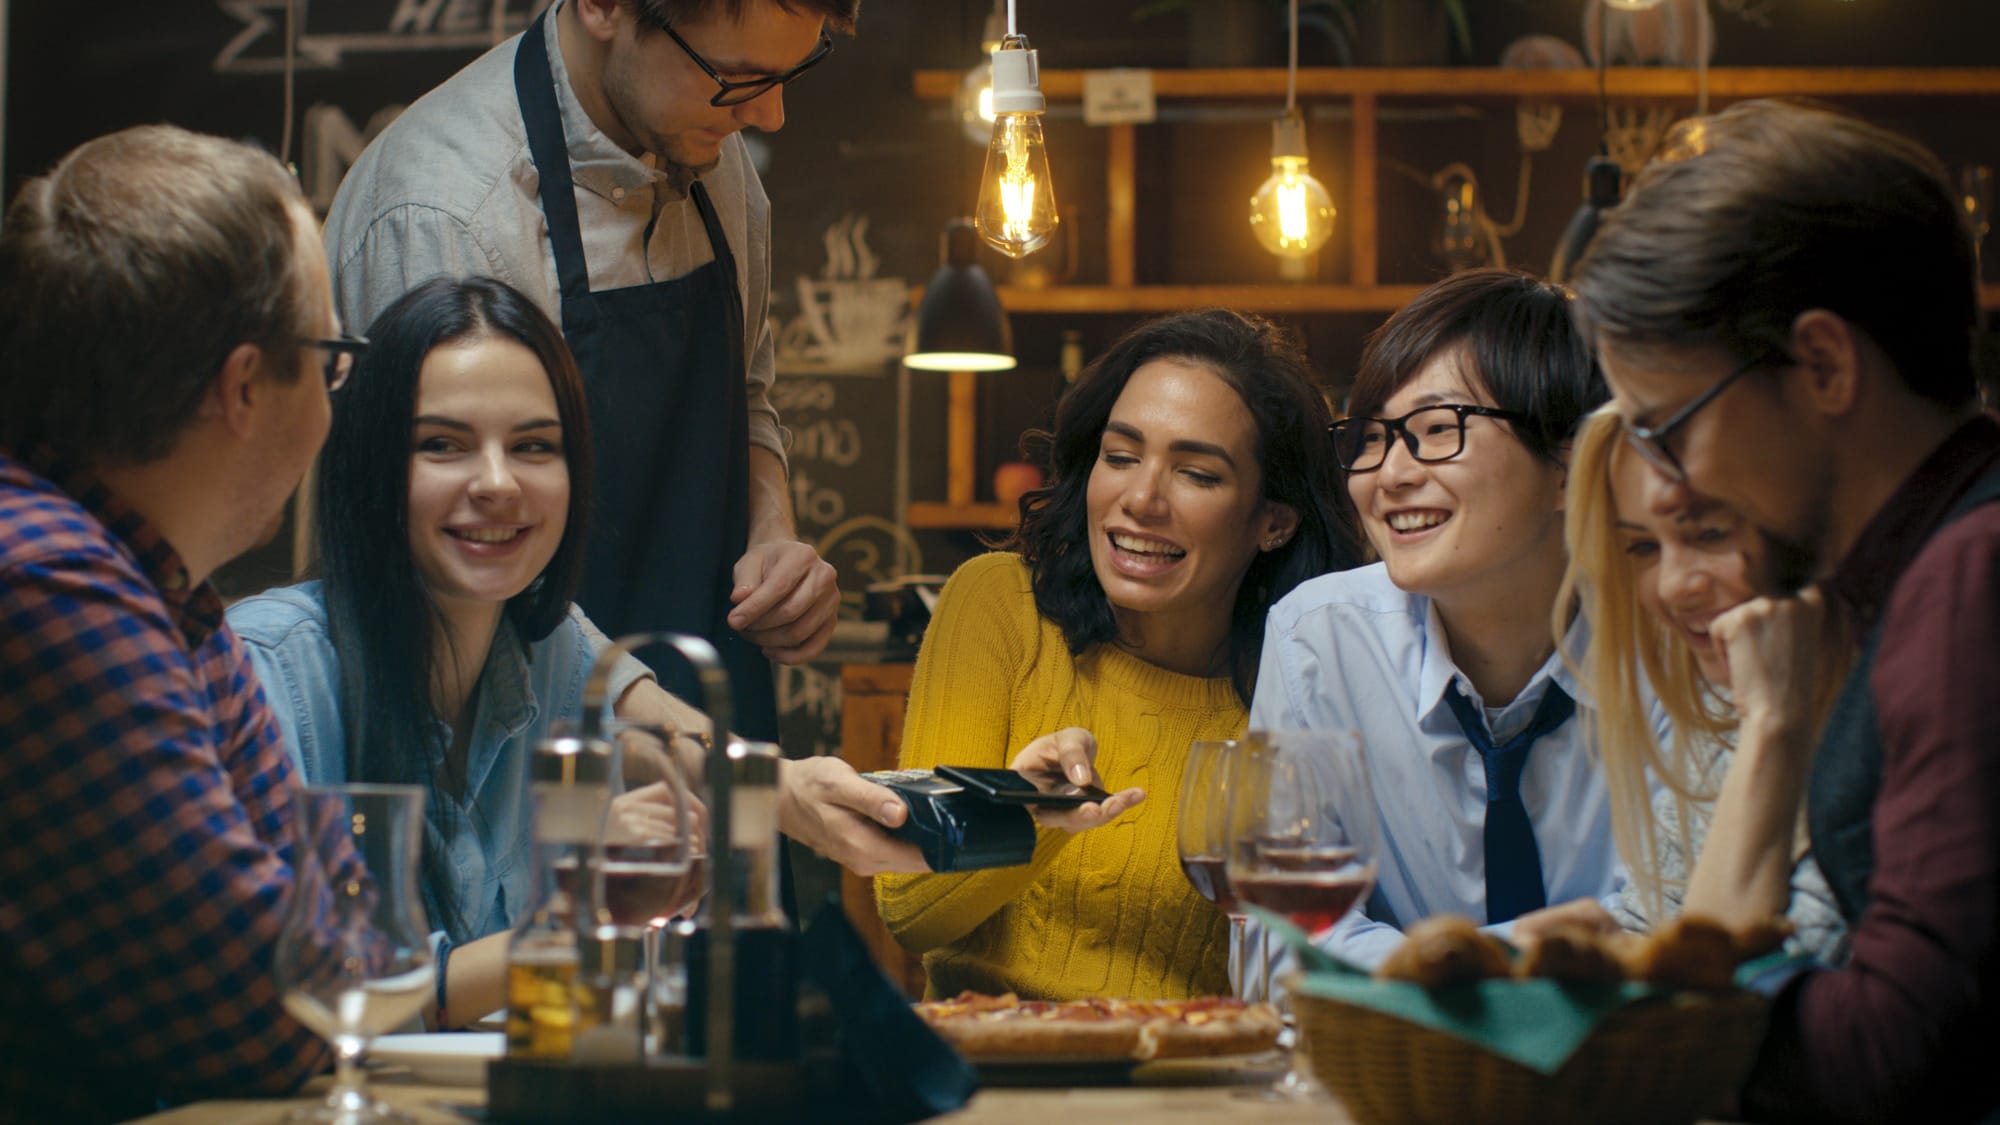
Key takeaway: Guests want convenient ways to order and make payments when it comes to dining out. A cloud-based restaurant POS system enables establishments to offer this while making transactions seamless.
- 75% of adults would like to be able to pre-order at sit-down restaurants
- 72% of adults would pay using contactless or mobile payment options
- 70% of adults would order and pay using a restaurant website
- 70% of adults would order and pay using a smartphone app
- 67% of adults would order and pay using a tablet at the table
- 65% of adults would order and pay using a self-service kiosk
- 62% of adults would access a menu through a QR code
- 62% of adults would pay using a digital wallet like Apple Pay, Samsung Pay, Google Wallet, or Venmo
- 51% of adults would place a takeout or food delivery order using Amazon Alexa, Google Home, or Apple Siri
- 15% of restaurants say they added fees or surcharges because of higher costs
- 46% of adults would order food that's prepared by a robot
Restaurant seating and operating cost statistics
Key takeaway: Outdoor seating has become more popular (especially in the summer), but occupancy and operating costs have gone up over the past years. Before expanding your hours or space, make sure there's enough demand to make it worth it.
- 70% of restaurants offered outdoor seating during the pandemic
- 69% of adults like the option of sitting outside at a restaurant
- 90% of restaurants with outdoor seating say they plan to continue to offer it
- Restaurant operating costs (supplies, G&B, etc.) rose by 16.7% over the past 3 years
- 48% of restaurants say they reduced hours of operation because of higher costs
- Restaurant utility costs rose by 11.8% over the past 3 years
- 32% of restaurants closed on days they would have normally been open because of higher costs
- Restaurant occupancy costs rose by 8.3% over the past 3 years
- 35% of restaurants say they stopped operating at full capacity because of higher costs
- 38% of restaurants say they postponed expansion plans because of higher costs
Restaurant marketing and loyalty statistics

Key takeaway: Guests want to take advantage of the deals and loyalty programs of their favorite restaurants. Customer loyalty software and marketing software make it easy for restaurants to get brand recognition and more regulars.
- 80% of consumers say they would participate in a loyalty program if it was offered by a restaurant they visit regularly
- 79% of adults would take advantage of discounts for dining on off-peak days
- 77% of adults would take advantage of discounts for dining at off-peak times of the day if they were offered
- 59% of adults would participate in a house account program if it was offered by their favorite restaurants. House account program: Customers pre-pay an amount to the restaurant and get a bonus amount added to their account. Ex: Pay $50 and get $60 in the account; pay $100 and get $125 in the account; pay $300, get $400. Funds are deducted from the account every time a guest dines and orders from the restaurant.
- 73% of adults would take advantage of pop-up specials if they were offered by a restaurant in their area Pop-up specials: Restaurants offer promotions that vary depending on how busy they are: lower prices or a free appetizer, dessert or drink on days when the restaurant is not busy. These are flexible changes made daily, best marketed through mobile apps and social media channels.
The data shows that guests still want to order and eat out. The restaurants that can serve customers wherever and whenever they're ready to eat will be the ones that thrive in the future.